2%
A personal research playground for rule-based equity strategies - built with data engineering discipline and pragmatic backtesting.
Where this started
The idea was born at university during long conversations with a friend. Coming from a non-finance family background, I discovered equities and wanted to explore a simple question: how far could I use software engineering to build a disciplined personal helper for buy/sell decisions?
My very first prototypes were built using historical data from the S&P 500. This initial phase wasn’t about investing real money yet — it was a deep dive into understanding the landscape: learning the differences between day trading and swing trading, exploring existing strategies and indexes, and assessing what “state of the art” looked like in retail investing. It was a mix of market research, technical experiments, and personal learning.
Over time, I shifted my focus to the French market, especially stocks eligible for a PEA (Plan d’Épargne en Actions). A PEA is a type of investment account available in France that offers tax advantages for investing in European companies. It was designed to encourage investment in local and regional businesses, making it a natural fit for my goal of developing strategies tailored to a specific, accessible universe — including the CAC 40 and other large-cap stocks listed in France.
Methodology
My approach is not about predicting single-stock prices with a black box. Instead, I focus on designing simple, explainable trading rules, then testing them across many securities and market conditions. I think of it as building an equation that improves over time: start with transparent technical heuristics, refine what works with statistics, and only then consider heavier algorithms once the foundations are strong.
I work with Yahoo Finance daily bars from 2015 to 2025, adding my own technical indicators such as J1 and J100. The universe is a fixed list of CAC 40 stocks, evaluated once per day to keep operational complexity low. Buy and sell decisions follow separate rules, optimized independently rather than mirroring each other.
Strategies are backtested over a decade that spans growth phases, crashes, rebounds, and quiet markets. I use grid searches to identify regions of stable performance instead of relying on one-off results. For speed, I currently omit transaction costs and execution delays, with plans to integrate them later.
At this stage, I avoid standard ratios like Sharpe or CAGR, focusing instead on raw performance consistency across stocks and time. This keeps the evaluation aligned with the logic of the rules rather than forcing them into predefined metrics.
- Consolidate the core library of transparent technical rules.
- Refine parameters and probe interactions with statistical tools.
- Explore advanced methods only once earlier tiers are solid.
In parallel, I plan to widen parameter sweeps, add market frictions, and expand beyond France — first to U.S. equities (e.g., S&P 500) — to reduce single-market bias and address survivorship effects in the CAC 40.
Intentional omissions: Benchmarking against an index is excluded for now, keeping the focus on absolute P&L and the internal logic of the rules.
Example: J1 / J100 mean-reversion-on-uptrend
Two simple custom indicators:
- J1: daily price change vs. the previous trading day.
- J100: price change vs. the last 100 trading days.
Hypothesis: if J100 > 0 (medium-term uptrend) and J1 < 0 (local dip), the drop may be temporary. The strategy simulates a buy on the dip in an existing uptrend, then exits via take-profit and/or indicator/time-based rules. Performance is benchmarked against the CAC40 index.
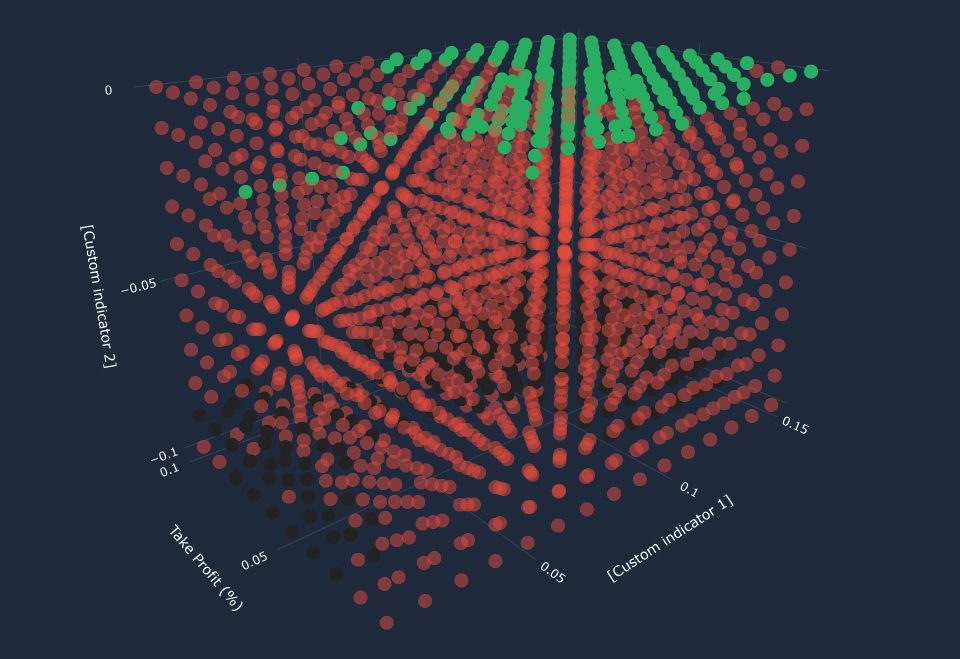
Grid search
A 3D parameter grid (e.g., TP threshold and two custom indicators). Each dot is a full backtest: black = negative vs. benchmark; red = positive but under benchmark; green = outperformed the benchmark.
What this shows about my Data Engineering
Key takeaways from building and iterating on this project.
- End-to-end execution: from sourcing 10 years of market data to building backtests and visualizations.
- Explainability-first: rules designed for clarity and iteration, avoiding black-box predictions.
- Experimentation discipline: parameter sweeps, robustness checks, and performance tracking across market regimes.